If you’re a pet owner, it should be no secret that Americans are crazy about their pets. The word on the street is that ownership has increased in recent years and people are spending more time and money on their pets than ever before. But what do the numbers say?
Here, we’ll explore where pet ownership and the pet population stand in the U.S. and how it differs across states and demographics. (If you're interested in facisinating statistical data from pet owners who are specifically interested in pet insurance, check out our free 2019-2020 report covering breeds, pre-existing conditions, pet names, and more.)
Below you'll find:
- What percentage of US households own a pet
- Interesting pet ownership data (like Millenials vs Boomers)
- Differences between dog and cat owners
- FAQs
- A list of all US states and their pet ownership stats
What Percentage of US Households Own a Pet?
Pet ownership rates fluctuate every few years in the United States, but they’ve generally been on the rise. In 2018, about 57% of US households include at least one pet.
The most recent Pet Ownership & Demographic Study (2018) by the AVMA shows that dogs are the most popular pets in the United States, followed closely by cats. This has been true since 1987, and likely since before then, too.
Americans are also fond of fish, horses, and other types of small furry creatures. Some Americans also keep an exotic animal or two at home. But some states don’t allow residents to keep certain exotic animals privately, and most states don’t allow residents to keep wild animals without special permits.
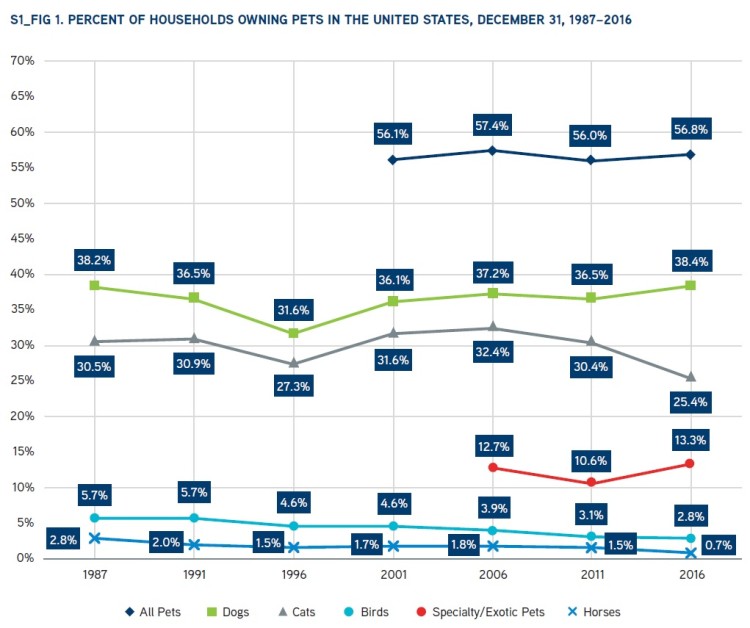 (Image Source: AVMA)
Looking at more recent raw numbers, Spots.com estimates that there has been a slow but steady increase in the number of dog and cat owners over the past several years. According to their Pet Ownership Statistics study, there are actually 85 million households in the US keeping pets, which means 67% of American homes included a pet in 2020:
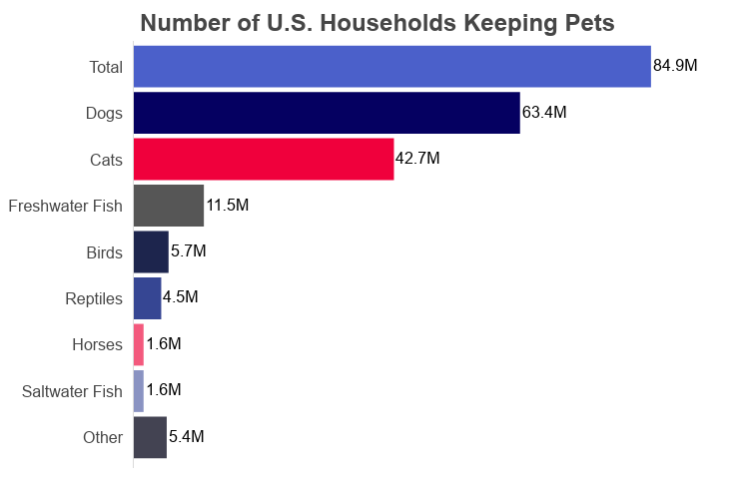 (Image Source: Spots.com
Most states include plenty of pet parents, but there are some differences in pet ownership depending on where you look.
States with large rural areas tend to have the highest rates of pet ownership. You’re also likely to find more dog owners in warm, rural states like Texas and more cats in colder states like Maine and Washington, according to Zippia.
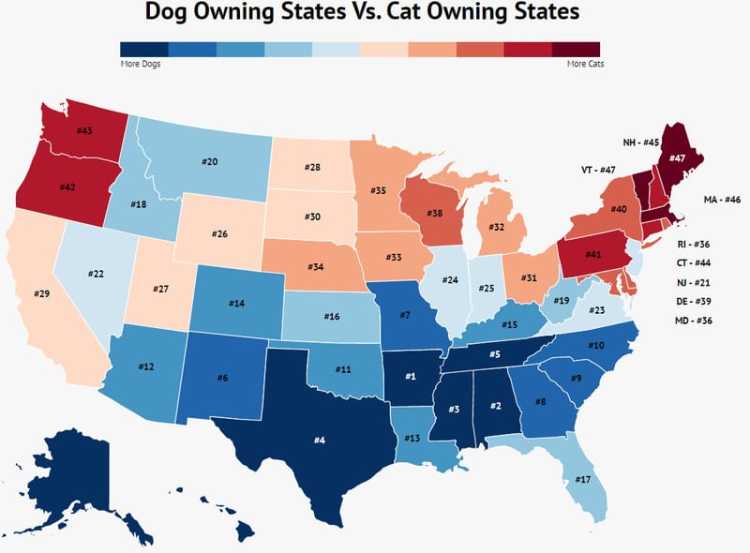 (Image Source: Zippia)
NOTE: Looking for a list of stats, state-by-state? Jump to the last section.
Interesting Pet Ownership Data
There are also differences in pet ownership based on age group, income, and other factors.
Millennials—who have reached ages between 25 and 39 years old in the last decade—have received special attention because of their high rate of pet ownership. But they only constitute 27% of all pet owners according to Packaged Facts.
But Baby Boomers have an even higher rate of pet ownership. Individuals in the 55 to 74-year-old age group increased their rate of pet ownership from 50% to 54% according to the same study. They also make up about 47% of aggregate expenditures on pets.
Meanwhile, the rate of pet ownership among 40 to 54-year-olds has stayed at about 64%.
According to studies conducted by the Urban Institute, pet ownership is also more nuanced than you might imagine:
- Most people are more likely to have a pet in their home than a child, except for people in their 40s.
- Homeowners and married couples are more likely to own pets than others, but there are far more households with pets than there are with children under 18.
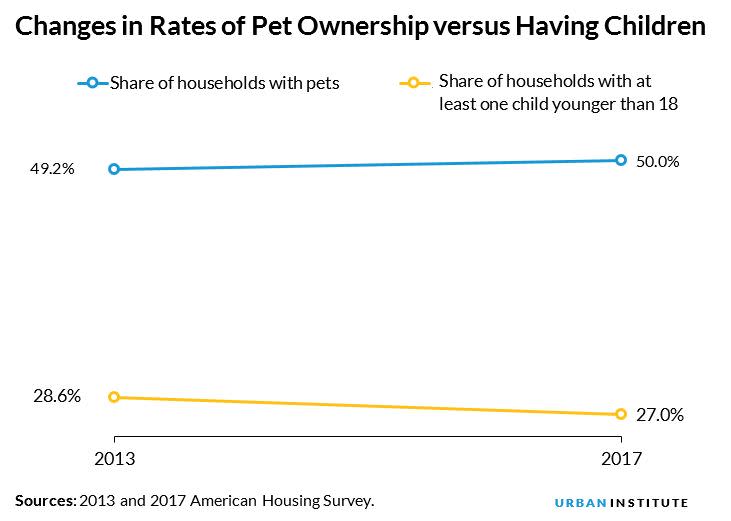 (Image Source: Urban Institute)
There’s even a correlation between your income and what types of pets you like. Ultra-high-net-worth (UHNW) individuals tend to like horses and dogs more than cats, fish, and birds, according to research firm Wealth-X:
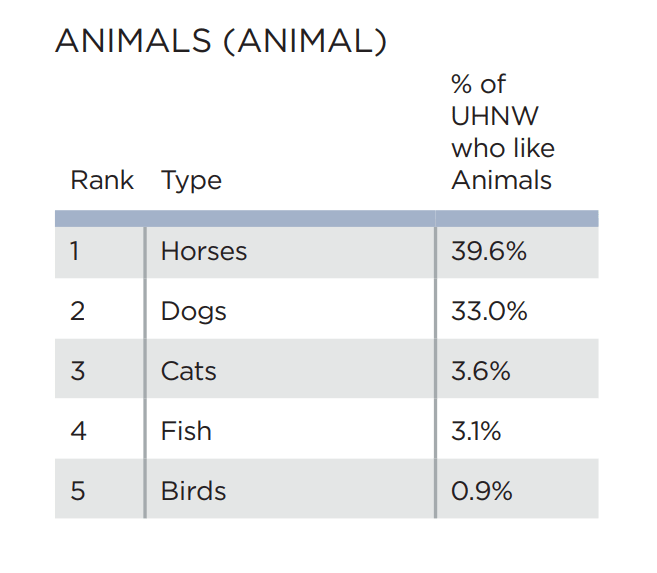 (Image Source: CNBC
This data shouldn’t be that surprising.
Animal care is expensive, and horses are more expensive than other types of animals to keep and care for. Dogs are also more expensive to own and care for than cats, so it makes sense that a household with a bigger pet budget would be more willing to own a dog.
Pawlicy Advisor, a national pet insurance marketplace, surveyed over 20,000 pet owners recently and found that only 1 out of 5 could afford to pay a common $5,000 vet bill without insurance coverage.
Interestingly, a study by Mars Pet Care found that there are clear differences between dog and cat owners.
Differences Between Dog and Cat Owners
- Dog owners are twice as likely to work in the financial field than cat owners.
- A cat owner is four times as likely to work in creative fields than a dog owner.
- Dog owners are more likely to enjoy hobbies like sports, dancing, and travel.
- Cat owners are more likely to enjoy hobbies like reading, writing, and gardening.
- 70% of cat owners credit their pets with stress reduction, compared to 66% of dog owners.
- 45% of dog owners say their dogs improve their lives through exercise, compared to just 8% of cat owners.
- Dog owners are twice as likely to celebrate their pet’s birthday with a party than cat owners.
A another study from a veterinary digest found that cat ownership is more common among women and older Americans: About 58% of cat owners are women, and the average age of cat owners is 55 to 64 years old.
Pet Ownership FAQs
Here are some of the most frequently asked questions about pet ownership statistics in the US.
What percentage of US households own at least one pet?
According to the most recent research by the AVMA, 57% of American households own a pet. However, another study indicated that as many as 67% of American households owned a pet in 2020.
What are the US states with the most pet owners?
The AVMA estimates that Wyoming and West Virginia have the highest rates of pet ownership.
Which US city has the most pet owners?
There are estimated to be more than 2.6 million privately-owned cats and dogs in Los Angeles. For context, there are roughly 1.1 million pets in New York City.
What age group owns the most pets?
40 to 54-year-olds. About 64% of them own a pet.
What is the average age of a dog owner?
The latest study we found, which was from 2005, shows the average age of a dog owner is about 47 years.
What country has no stray dogs?
The Netherlands reduced its stray dog population to nearly zero in 2019. They accomplished this through a nation-wide collect, neuter, vaccinate, and return (CNVR) program, as well as through high taxes on any animal bought from stores. The latter encouraged more people to adopt from animal shelters.
Who owns the most dogs in the world?
The United States. It’s home to about 83.3 million, according to the American Pet Products Association.
What is the most popular dog breed?
According to the American Kennel Club, the Labrador Retriever has been the most popular dog breed in the United States for 29 years.
The US States with the Most Pet Owners
According to a study by the AVMA, Wyoming and West Virginia were the two states with the highest rates of pet ownership in 2018. Pet ownership is also generally lower in urban areas. Rhode Island, New York, and New Jersey were three of the states with the lowest rates of pet ownership in the AVMA study.
Meanwhile, the three states with the highest rates of dog ownership were Idaho, Montana, and Arkansas. The states with the lowest rates of dog ownership were New Hampshire, Connecticut, and Rhode Island.
Now, let’s explore pet ownership rates and other interesting statistics state by state.
The statistical information listed below is based on the results of the AVMA study unless specified otherwise. Note that data for Alaska and Hawaii was not available in the AVMA study, and some states were missing some specific data.
Alabama Pet Ownership Stats
- 59.8% of Alabama households own a pet.
- 46.9% of Alabama households own a dog.
- 26.1% of Alabama households own a cat.
Arizona Pet Ownership Stats
- 58% of Arizona households own a pet.
- 43% of Arizona households own a dog.
- 26.4% of Arizona households own a cat.
Arkansas Pet Ownership Stats
- 69% of Arkansas households own a pet.
- 51.6% of Arkansas households own a dog.
- 34.8% of Arkansas households own a cat.
California Pet Ownership Stats
- 40.1% of California households own a pet.
- 22.9% of California households own a cat.
- Nearly 40% of California households own at least one dog. (Source)
Colorado Pet Ownership Stats
- 47.2% of Colorado households own a pet.
- 27.1% of Colorado households own a dog.
Connecticut Pet Ownership Stats
- 49.9% of Connecticut households own a pet.
- 24% of Connecticut households own a dog.
- 26.7% of Connecticut households own a cat.
Delaware Pet Ownership Stats
- 57.9% of Delaware households own a pet.
- 42.2% of Delaware households own a dog.
- 24.1% of Delaware households own a cat.
Florida Pet Ownership Stats
- 56% of Florida households own a pet.
- 39.8% of Florida households own a dog.
- 24.2% of Florida households own a cat.
- WalletHub named Tampa, Florida the #1 most pet-friendly city in America in 2020. (Source)
Georgia Pet Ownership Stats
- 51.1% of Georgia households own a pet.
- 36.7% of Georgia households own a dog.
- 20.4% of Georgia households own a cat.
Idaho Pet Ownership Stats
- 69.9% of Idaho households own a pet.
- 33.3% of Idaho households own a dog.
- 34.4% of Idaho households own a cat.
Illinois Pet Ownership Stats
- 48.6% of Illinois households own a pet.
- 32.4% of Illinois households own a dog.
- 21% of Illinois households own a cat.
Indiana Pet Ownership Stats
- 69.2% of Indiana households own a bet.
- 49.4% of Indiana households own a dog.
- 37.5% of Indiana households own a cat.
Iowa Pet Ownership Stats
- 59.4% of Iowa households own a pet.
- 36.3% of Iowa households own a dog.
- 35.6% of Iowa households own a cat.
Kansas Pet Ownership Stats
- 62.8% of Kansas households own a pet.
- 43.1% of Kanas households own a dog.
- 32.4% of Kansas households own a cat.
Kentucky Pet Ownership Stats
- 64.1% of Kentucky households own a pet.
- 46.5% of Kentucky households own a dog.
- 32.2% of Kentucky households own a cat.
Louisiana Pet Ownership Stats
- 54.4% of Louisiana households own a pet.
- 38.3% of Louisiana households own a dog.
- 19% of Louisiana households own a cat.
Maine Pet Ownership Stats
- 63.5% of Main households own a pet.
- 35.9% of Maine households own a dog.
- 43.6% of Maine households own a cat.
Maryland Pet Ownership Stats
- 48.6% of Maryland households own a pet.
- 30.2% of Maryland households own a dog.
- 18.6% of Maryland households own a cat.
Massachusetts Pet Ownership Stats
- 49.4% of Massachusetts households own a pet.
- 28.9% of Massachusetts households own a dog.
- 23.5% of Massachusetts households own a cat.
Michigan Pet Ownership Stats
- 62.4% of Michigan households own a pet.
- 41.9% of Michigan households own a dog.
- 31.2% of Michigan households own a cat.
Minnesota Pet Ownership Stats
- 54% of Minnesota households own a pet.
- 35.50% of Minnesota households own a dog.
- 26.50% of Minnesota households own a cat.
Mississippi Pet Ownership Stats
- 65.50% of Mississippi households own a pet.
- 51.00% of Mississippi households own a dog.
- 29.10% of Mississippi households own a cat.
Missouri Pet Ownership Stats
- 63.50% of Missouri households own a pet.
- 45.10% of Missouri households own a dog.
- In 2017, 718,000 Missouri households owned a cat. (Source)
Montana Pet Ownership Stats
- 61.9% of Montana households own a pet.
- 51.90% of Montana households own a dog.
- 22.80% of Montana households own a cat.
Nebraska Pet Ownership Stats
- 51.3% of Nebraska households own a pet.
- 47.1% of Nebraska households own a dog.
- 30.9% of Nebraska households own a cat.
Nevada Pet Ownership Stats
- 53.3% of Nevada households own a pet.
- 36.8% of Nevada households own a dog.
- 23.1% of Nevada households own a cat.
New Hampshire Pet Ownership Stats
- 51.8% of New Hampshire households own a pet.
- 23.7% of New Hampshire households own a dog.
- 36.4% of New Hampshire households own a cat.
New Jersey Pet Ownership Stats
- 47.4% of New Jersey households own a pet.
- 29.1% of New Jersey households own a dog.
- 18.9% of New Jersey households own a cat.
New Mexico Pet Ownership Stats
- 60.10% of New Mexico households own a pet.
- 39.4% of New Mexico households own a dog.
- 25.2% of New Mexico households own a cat.
New York Pet Ownership Stats
- 49.7% of New York households own a pet.
- 27% of New York households own a dog.
- 21.1% of New York households own a cat.
North Carolina Pet Ownership Stats
- 58.6% of North Carolina households own a pet.
- 41.3% of North Carolina households own a dog.
- 26.5% of North Carolina households own a cat.
North Dakota Pet Ownership Stats
- 63.7% of North Dakota households own a pet.
- 44.3% of North Dakota households own a dog.
- 24.8% of North Dakota households own a cat.
Ohio Pet Ownership Stats
- 62.4% of Ohio households own a pet.
- 37.9% of Ohio households own a dog.
- 30.7% of Ohio households own a cat.
Oklahoma Pet Ownership Stats
- 65% of Oklahoma households own a pet.
- 47.7% of Oklahoma households own a dog.
- 38.4% of Oklahoma households own a cat.
Oregon Pet Ownership Stats
- 59.2% of Oregon households own a pet.
- 37.8% of Oregon households own a dog.
- 30% of Oregon households own a cat.
Pennsylvania Pet Ownership Stats
- 60.6% of Pennsylvania households own a pet.
- 38.9% of Pennsylvania households own a dog.
- 29.9% of Pennsylvania households own a cat.
Rhode Island Pet Ownership Stats
- 45.4% of Rhode Island households own a pet.
- 25.8% of Rhode Island households own a dog.
- 16.7% of Rhode Island households own a cat.
South Carolina Pet Ownership Stats
- 62% of South Carolina households own a pet.
- 45.3% of South Carolina households own a dog.
- 25.2% of South Carolina households own a cat.
South Dakota Pet Ownership Stats
- 46.4% of South Dakota households own a pet.
- 32.1% of South Dakota households own a dog.
- 26.6% of South Dakota households own a cat.
Tennessee Pet Ownership Stats
- 61.7% of Tennessee households own a pet.
- 47% of Tennessee households own a dog.
- 30.9% of Tennessee households own a cat.
Texas Pet Ownership Stats
- 58.2% of Texas households own a pet.
- 43.4% of Texas households own a dog.
- 20.5% of Texas households own a cat.
Utah Pet Ownership Stats
- 58.5% of Utah households own a pet.
- 36.2% of Utah households own a dog.
- 24.7% of Utah households own a cat.
Vermont Pet Ownership Stats
- 70% of Vermont households own a pet.
- 28.3% of Vermont households own a dog.
- 44.6% of Vermont households own a cat.
Virginia Pet Ownership Stats
- 55.5% of Virginia households own a pet.
- 35.6% of Virginia households own a dog.
- 23.9% of Virginia households own a cat.
Washington Pet Ownership Stats
- 62.7% of Washington households own a pet.
- 42.8% of Washington households own a dog.
- 30.5% of Washington households own a cat.
West Virginia Pet Ownership Stats
- 70.7% of West Virginia households own a pet.
- 49.6% of West Virginia households own a dog.
- 37.7% of West Virginia households own a cat.
Wisconsin Pet Ownership Stats
- 59% of Wisconsin households own a pet.
- 33.6% of Wisconsin households own a dog.
- 32.4% of Wisconsin households own a cat.
Wyoming Pet Ownership Stats
- 71.8% of Wyoming households own a pet.
- 36% of Wyoming households own a dog.
- 30% of Wyoming households own a cat.